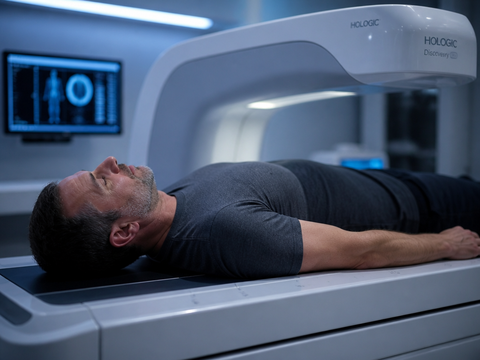
Two people walk into a body-composition lab. They are the same age, the same height, the same weight. Their DEXA scans report nearly identical lean mass and nearly identical total fat. On paper they are twins. One of them squats 1.6 times bodyweight and climbs three flights of stairs without a thought. The other struggles out of a low chair and fasting glucose runs high. If the numbers match, why don't the bodies?
Part of the answer lives inside the muscle itself — in the fat woven through it, the intramuscular adipose tissue that conventional body-composition metrics were never built to see. This piece is about that hidden compartment: what it is, how we measure it (badly, mostly), where it comes from, and whether the strength-and-glucose gap above can be pinned on it. The honest answer in several places is "it depends," and we will say so each time it's true.
The verdict, stated plainly
Fat stored within skeletal muscle is a distinct compartment with its own metabolic and mechanical consequences, and it is largely invisible to BMI, total body-fat percentage, and standard DEXA output. Higher levels track with insulin resistance, lower muscle force per unit of muscle, and worse physical function in older adults. But the direction of causation is not fully settled, the measurement tools disagree with each other, and the evidence that exercise removes it is weaker than the evidence that exercise improves everything around it. Treat it as a meaningful signal of muscle quality — not as a number you can chase the way you chase a deadlift PR.
What we mean by fat inside muscle
Adipose tissue in and around skeletal muscle is usually split into three locations, and the distinctions matter because they don't behave alike.
- Subcutaneous fat sits under the skin, above the muscle's outer wrapping (the fascia). This is the fat you can pinch. It is metabolically the least troublesome of the three.
- Visceral fat packs around the organs in the abdominal cavity. It is the compartment most discussed in cardiometabolic risk.
- Fat inside the muscle is the subject here. It comes in two forms that are worth separating: fat held inside the muscle fibers as droplets (intramyocellular lipid, a normal fuel store), and fat deposited between and around the fibers and fascicles, infiltrating the lean tissue. It is this second, infiltrating form — sometimes called intermuscular or intramuscular fat depending on the resolution of the imaging — that correlates with dysfunction.
The taxonomy is not just pedantry. A trained endurance athlete can carry high intramyocellular lipid — droplets parked right next to mitochondria as accessible fuel — and be exquisitely insulin sensitive. This is the so-called athlete's paradox first described in detail by Goodpaster and colleagues in 2001: the same lipid signature that flags trouble in a sedentary person flags readiness in a trained one. So the question is never simply "is there fat in the muscle." It is "what kind, where, and in whose muscle."
Why your scale and most reports can't see it
Here is the measurement problem in one sentence: the tools that are cheap and common can't resolve fat inside muscle, and the tools that can resolve it are expensive, slow, or invasive.
BMI and bathroom scales measure nothing about distribution. Two people at identical weight can have wildly different internal architecture. BMI is a population screening tool wearing the costume of an individual diagnosis.
Bioelectrical impedance (the metal-footplate scales and handheld units) estimates total fat and lean mass from how a small current passes through tissue. It cannot localize fat to a compartment. Its whole-body fat number can be reasonable while telling you nothing about muscle quality.
DEXA is better and worse than people assume. Standard DEXA reports lean mass, fat mass, and bone by region. But the fat woven through a muscle gets partly counted as part of "lean" soft tissue or smeared across the region average, depending on the algorithm. DEXA was not designed to isolate the infiltrating fat compartment, and its standard output won't give it to you.
CT can. On a CT cross-section, tissue is graded in Hounsfield units, and fat and muscle fall in different, well-characterized ranges. A muscle riddled with fat appears mottled and reads lower in attenuation; researchers quantify this as reduced muscle radiodensity. This is the workhorse measure in the aging literature, and it is the basis for much of what we know. The cost is radiation and access.
MRI maps fat and water without ionizing radiation and is arguably the cleanest non-invasive picture, but it is expensive, time-consuming, and not standardized across labs.
Muscle biopsy is the closest thing to ground truth for the cellular detail, and it is a needle into your thigh that samples a few cubic millimeters and cannot be repeated casually.
We flag this up front because it shapes everything downstream. When two studies disagree about whether an intervention reduced fat inside muscle, the first question is rarely "who's right" and often "did they measure the same thing." A CT radiodensity change and an MRI fat-fraction change and a DEXA region-fat change are three different windows onto an object none of them sees completely.

| Method | Can it isolate fat inside muscle? | Practical cost | Main limitation |
|---|---|---|---|
| BMI / scale | No | Trivial | Measures nothing about distribution |
| Impedance | No | Low | Whole-body estimate only |
| DEXA (standard) | Partly / indirectly | Moderate | Infiltrating fat blurs into region averages |
| CT (Hounsfield) | Yes | High + radiation | Dose, access |
| MRI fat-fraction | Yes | High | Cost, no cross-lab standard |
| Biopsy | Yes (cellular) | High + invasive | Tiny sample, not repeatable |
Where the fat inside muscle comes from
To understand why this compartment expands, you have to look at who builds it. Muscle is not just muscle fibers. It contains a resident population of progenitor cells, the most relevant of which are the fibro/adipogenic progenitors (FAPs). In healthy muscle, FAPs are quiet support staff: after injury they release signals that help muscle stem cells repair fibers, and then they retreat.
The trouble starts when the signaling environment changes. Under chronic disuse, denervation, aging, obesity, or certain disease states, FAPs stop behaving like support staff and start differentiating down a fat-cell lineage. Instead of helping rebuild contractile tissue, they lay down adipocytes between the fibers. The result is muscle that is structurally diluted — lean architecture interleaved with fat that does no mechanical work.
There is a separate, older debate about whether muscle stem cells themselves can convert to fat under the wrong conditions. The cleaner current view from lineage-tracing work in animal models — Joe and colleagues and Uezumi and colleagues, both 2010 — points to FAPs as the principal source of fat infiltration, not transdifferentiated muscle fibers. That distinction matters because it locates the problem in a regulatory cell population rather than in the contractile cells betraying their identity.
What triggers the switch in any given human, at any given site, is not fully understood. The candidate drivers — inflammation, lipid oversupply, reduced mechanical loading, insulin resistance, age-related changes in the progenitor niche — clearly travel together, which makes isolating cause from consequence genuinely hard. We are honest about this because the mechanism literature is, too: there is a strong pathway sketch and a long list of unresolved details.
What it does once it's there
Granting that fat infiltration is real and hard to measure, what does it actually cost the person carrying it? Three categories, each with its own strength of evidence.
Metabolic cost
Fat inside muscle is consistently associated with insulin resistance. Goodpaster and colleagues showed in the late 1990s and early 2000s that lower mid-thigh muscle attenuation on CT — more infiltrating fat — tracked with worse insulin sensitivity, independent of total adiposity and even of visceral fat in some analyses. The proposed mechanism is local: adipocytes and the lipid intermediates they shed (diacylglycerols, ceramides) interfere with insulin signaling in the neighboring fibers, blunting glucose uptake in the tissue that is supposed to be the body's largest glucose sink.
The caveat, again, is the athlete's paradox. Lipid near the muscle is not uniformly bad; the metabolic harm appears tied to the infiltrating, between-fiber pattern and to the lipid species involved, not to the mere presence of fat in the region. Association is robust; clean causal proof in humans is harder.
Mechanical cost
This is the part gym-goers underrate. Muscle generates force in proportion to its contractile cross-section. Fat woven through a muscle inflates its apparent size without adding any contractile material — so a "big" muscle on a tape measure can be partly passive filler. The functional consequence is reduced specific force: less strength per unit of muscle volume.
There is also a force-transmission argument. Muscle fibers transmit force not only end-to-end through tendon but laterally, through the connective-tissue matrix surrounding them. Fat deposited in that matrix plausibly disrupts efficient lateral transmission and alters the mechanical behavior of the surrounding tissue. The cross-sectional associations between fat infiltration and lower strength are strong; the precise biomechanical mechanism is still being worked out and is partly inferred.
Functional cost
In older adults the downstream picture is the clearest, because it has been studied longitudinally. The Health, Aging and Body Composition (Health ABC) study followed thousands of older adults and found that lower muscle attenuation — more fat in the muscle — predicted worse mobility, slower gait, and a higher risk of losing the ability to do daily tasks, even after accounting for muscle size. In other words, the quality of the muscle predicted function better than the quantity did. Visser and colleagues (2002, 2005) reported this fat-infiltration signal as an independent predictor of mobility limitation and lower-extremity performance.
This is the strongest argument for caring about the compartment at all: it explains, in part, why two people with the same lean mass age into very different bodies.
So is it the cause of the gap, or just a marker?
Return to our two lab twins. Can we say the infiltrating fat made one weak and pre-diabetic? Here is where intellectual honesty earns its keep.

The associations are real, repeated, and survive adjustment for the obvious confounders. But fat infiltration, insulin resistance, low physical activity, and aging form a tangle in which each plausibly feeds the others. Disuse promotes the progenitor cells to deposit fat; the fat worsens local insulin signaling; insulin resistance and weakness reduce activity; reduced activity promotes more deposition. Sorting the arrows requires interventions that change one variable and watch the others, and those studies are thinner than the cross-sectional ones.
So the defensible statement is: fat inside muscle is at minimum a high-quality marker of muscle that is metabolically and mechanically compromised, and there is mechanistic and some longitudinal support for it being a partial cause of the dysfunction — not merely a bystander. We will not pretend the causal case is closed.
Can you get rid of it? It depends — and here's on what
This is the question that brings most people to the topic, and it has the least satisfying answer.
Exercise and weight loss reliably improve the things fat infiltration is associated with — insulin sensitivity, strength, function — and they do this even when the imaging measure of infiltration barely moves. That decoupling is the single most important thing to absorb. You can get metabolically and functionally better while the fat-in-muscle number is stubborn.
The reduction evidence itself is genuinely mixed:
- Some weight-loss and exercise interventions in older or metabolically impaired adults report modest reductions in fat infiltration measured by CT or MRI over several months.
- Others — including resistance-training studies in older adults — report strength and function gains with little or no change in the infiltration measure, and a few report the muscle getting better (denser) without the regional fat moving much.
- The outliers tend to differ in population (young vs old, healthy vs diseased), in dose and type of training, and crucially in measurement method. A study using DEXA region-fat and one using CT attenuation are not asking the muscle the same question.
What this means practically: the fat already deposited may be partly resistant to removal, particularly in older muscle where the progenitor environment has shifted. The more reliable lever is preventing further infiltration and improving the surrounding tissue — keeping the muscle loaded, keeping it active, keeping systemic insulin sensitivity high. The exact degree to which any specific protocol reverses existing infiltration is not established, and anyone selling you a number on that is overstating the literature.
Who should actually care about this
Care, and ask your clinician to think in terms of muscle quality, not just mass:
- Older adults, especially anyone noticing trouble rising from chairs or climbing stairs despite "normal" weight. Muscle quality predicts function here better than muscle size.
- People with type 2 diabetes or insulin resistance whose body fat looks unremarkable. The relevant fat may be in a place the standard report doesn't surface.
- Anyone recovering from prolonged disuse — limb immobilization, bed rest, post-surgical deconditioning — when progenitor cells are most prone to depositing fat in unloaded muscle. The window for prevention is early.
- Clinicians reading CT or MRI for other reasons who can note muscle attenuation as a free secondary signal.
Don't lose sleep over it:
- Healthy, active people with no metabolic flags chasing a number they can't even measure at home. The marker is most useful where dysfunction already exists.
- Athletes alarmed by the word "fat" near "muscle." Intramyocellular lipid in a trained, insulin-sensitive person is fuel, not pathology — the athlete's paradox is real.
- Anyone tempted to buy a consumer device promising to report fat inside their muscle. No home device resolves this compartment. The honest tools are CT, MRI, and biopsy, and you do not order those casually.
The line worth screenshotting
The most useful number in body composition is not how much fat you carry but where it sits relative to the tissue that has to do work — and the fat woven through your muscle is the part the scale will never tell you about.
Evidence grade
For the central claim — that fat infiltration within skeletal muscle is a distinct compartment associated with insulin resistance, lower force per unit of muscle, and worse physical function, and is invisible to standard body-composition metrics: Strong for the association and for invisibility to common tools; Moderate for it being a partial cause rather than only a marker; Weak for the proposition that any specific exercise protocol meaningfully reverses existing infiltration. We grade the reversibility claim lowest deliberately, because the measurement methods disagree and the intervention trials are small and heterogeneous. Reviewer note (one of us). I stopped using the tape measure on my own thigh as a progress signal about two years ago, after a CT taken for an unrelated reason came back with a muscle-attenuation value lower than I'd have guessed from how the leg looked. Nothing dramatic — within a normal range — but it was a quieter number than the circumference suggested. Since then the thing I actually track is whether I can still do a slow, controlled single-leg sit-to-stand without using my hands, on both sides, the way I could at thirty. It is a crude proxy for muscle that does work rather than muscle that merely occupies space. It costs nothing, it needs no device, and on the mornings it gets harder it tells me something the scale spent years refusing to.