Every consumer sleep tracker sold today reports a number it calls deep sleep. It arrives as a colored band on a phone screen, usually with a percentage, sometimes with a verdict attached — low, below your average, needs attention. For readers managing sleep disorders, or worried they might have one, that band has quietly become the thing they check first in the morning.
We wore four of them at once, on the same body, on the same nights, for a month. Here is the verdict up front: the devices agreed on how long we slept to within about 17 minutes, and disagreed about how much of that sleep was "deep" by a median of 38 minutes — a spread larger than the night-to-night change most people are trying to detect. The totals are usable. The stage bars are not, and the reason goes back to a committee that met in 1968.
How we tested
Four device classes, worn simultaneously, every night:
- Wrist: accelerometer plus photoplethysmography (optical heart rate and heart-rate variability)
- Ring: same sensor family, finger-mounted, with skin temperature
- Mat: under-mattress ballistocardiography — no contact with the body, reads movement and cardioballistic force through the mattress
- Headband: two dry frontal EEG channels plus an accelerometer, the only device in the set that measures brain electrical activity at all
We are not naming brands. That is a deliberate editorial call, and we will defend it: a single primary sleeper across 25 nights cannot support a brand-level verdict. It can support a category-level one. Naming products here would imply a precision the sample size does not carry.
Sleepers. One primary (38, no diagnosed sleep condition, habitual 7–7.5 h) for 28 consecutive nights. One secondary (52, occasional sleep-maintenance complaints) for 9 nights. Two acclimation nights were run before the count began and discarded.
Conditions. Lights out between 22:45 and 23:15. No alcohol for the duration. Caffeine cutoff 13:00. Bedroom held at 18–19 °C, blackout blinds, no partner or pet in bed. Wrist and ring on opposite hands so the two optical sensors could not shadow each other. Mat positioned under the mattress at chest level per its own instructions.
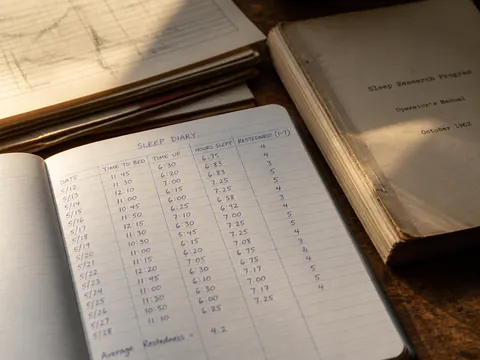
Blinding, such as it was. Each morning we filled in a paper diary before opening any app: clock time at lights-out, estimated time to fall asleep, number of remembered awakenings, and a 1–7 restedness rating. Then we exported raw nightly summaries from all four platforms. This is a weak blind — you know roughly how you slept — but it prevents the more serious contamination, which is reading a device's verdict and then writing down a matching feeling.
Exclusions. Three nights dropped: one mat dropout, one headband battery failure, one night away from home. Final dataset: 25 four-device nights on the primary sleeper, 8 on the secondary. 33 nights, 132 device-nights.
What we could not do. We had no polysomnography. No clinical lab, no scored EEG/EOG/EMG montage, no human technician. That is the central limitation of this test and we are not going to bury it. Without a reference standard, we cannot say any device is accurate. We can only say whether the devices agree with each other and with the sleeper — which is a real and under-reported measurement, because a set of instruments that disagree this sharply cannot all be right.
Analysis. For each night we computed pairwise absolute differences between all six device pairs for total sleep time, sleep onset latency, wake after sleep onset, N3 ("deep"), and REM. We ran Spearman rank correlations per pair. And we asked the question that actually matters to a user: when one device flags a bad night, do the others agree it was a bad night?
What the devices did
Total sleep time. Good news first. Median pairwise absolute difference: 17 minutes. Ninetieth percentile: 44 minutes. Worst single pair on a single night: 61 minutes, on a night with a long fragmented stretch around 03:00 that the mat read as sleep and the wrist read as wake. For a metric people care about — did I get seven hours or six — four different sensor technologies converged to within about a quarter hour most nights. That is a genuinely decent result and it deserves to be said plainly.
Sleep onset latency. Median pairwise difference 9 minutes, maximum 31. The mat consistently called sleep onset earliest, which is what you would expect from a device that infers sleep from stillness and cardiac signal without any cortical measure.
Wake after sleep onset. Median pairwise difference 21 minutes. The wrist reported roughly twice as much fragmentation as the mat across the month. Neither is checkable without a reference, but they cannot both be describing the same night.
Deep sleep. This is where the test breaks open. Median nightly N3 estimate, per device, across the same 25 nights:
- Mat: 43 min
- Wrist: 58 min
- Ring: 71 min
- Headband: 96 min
Median pairwise absolute difference: 38 minutes. Largest single-night pair difference: 104 minutes — one device saw nearly two hours of deep sleep where another saw twenty minutes, in the same skull, on the same mattress.

Worse for the user, the rankings did not line up either. Spearman correlations between device pairs for nightly N3 ranged from ρ = 0.05 to ρ = 0.31; at n = 25 you need roughly 0.40 to clear conventional significance, so none of them did. Concretely: of the six nights the ring placed in its own worst quartile for deep sleep, the wrist agreed on two, the mat on two, the headband on one. Chance agreement would be about 1.5. If your ring tells you Tuesday was a bad deep-sleep night, the wrist on your other arm is close to a coin flip on whether it noticed.
REM held up better — median pairwise difference 24 minutes, wrist-to-ring ρ = 0.42 — which is consistent with REM having a distinctive autonomic signature (heart-rate variability, respiratory irregularity) that optical sensors can genuinely detect.
And the diary. Across all 33 pooled nights, morning restedness correlated modestly with total sleep time (ρ = 0.38) and with the number of remembered awakenings (ρ = −0.41). It correlated with none of the four deep-sleep estimates: every |ρ| came in at 0.14 or below. Thirty-three nights on two people cannot prove an absence. But the thing the apps put at the top of the screen was the thing least related to how we actually felt.
Where "deep sleep" came from
To understand why four instruments can disagree this badly, it helps to know what they are trying to reproduce — because none of them is measuring depth. They are all trying to guess what a human scorer would have written down, and that human is following rules with a specific and surprisingly recent history.
In 1953, Eugene Aserinsky and Nathaniel Kleitman published a short paper in Science describing regularly recurring periods of rapid eye movement during sleep, recorded in a University of Chicago basement lab on equipment scavenged and rebuilt by hand. The subject pool was tiny; one of the earliest sleepers was Aserinsky's young son. In 1957 Kleitman and William Dement described the cyclical progression through EEG patterns across the night — the architecture that every sleep-stage graphic on every phone still redraws. It was extraordinary work. It was also a handful of young adults, in one lab, on ink-on-paper recordings.
By the mid-1960s a dozen labs were staging sleep and none of them agreed on the boundaries. So in 1968 a committee convened under the UCLA Brain Information Service, chaired by Allan Rechtschaffen and Anthony Kales, and published A Manual of Standardized Terminology, Techniques and Scoring System for Sleep Stages of Human Subjects — the R&K manual. It did what standards do: it picked.
It picked 30-second epochs. The usual account, and the one scorers of that era tell, is that this followed from paper: chart recorders ran at 10 mm per second, so a standard page held 30 seconds of trace. One page, one score. Sleep does not change state every thirty seconds; the page did.
It picked 75 microvolts as the amplitude threshold above which a slow wave counts as a slow wave. Not 60, not 100. It picked 20 percent of an epoch filled with such waves as the boundary for stage 3, and 50 percent for stage 4. These thresholds were set by consensus among experienced scorers so that different labs would produce comparable numbers. They were not derived from outcomes. Nobody demonstrated that a night with 21 percent slow-wave content restores something a night with 19 percent does not.
In 2007 the American Academy of Sleep Medicine issued its own manual and made two changes worth sitting with. It merged stages 3 and 4 into a single stage, N3 — the four-stage pyramid people still picture had been an administrative division all along. And it recommended frontal derivations for staging where R&K had leaned central. Slow-wave activity is frontally predominant; measure the same sleeper at F4 instead of C4 and you cross the 75 µV threshold more often. The rulebook changed, the brains did not, and the deep-sleep numbers moved.
So: a cycle described in a handful of subjects, epoch-length inherited from chart paper, an amplitude cutoff chosen by a committee, a stage boundary at 20 percent for no outcome-derived reason, and a 2007 revision that shifted the measured quantity by changing where the electrodes sit. That is the source. The belief resting on it — that your deep-sleep percentage is a physiological quantity with a correct value — is considerably thicker than the source.
The 82 percent ceiling
Here is the constraint that no consumer device can engineer its way past.
When the AASM ran large-scale inter-scorer reliability testing through its online program, overall agreement between certified human scorers landed at roughly 83 percent (Rosenberg and Van Hout, 2013). Agreement was highest for REM and N2 and markedly worse for N1. Earlier comparisons of R&K against AASM rules (Danker-Hopfe and colleagues, 2009) found overall agreement in the same neighborhood, around 80 percent, with stage-specific agreement lower still.
That is trained professionals, scoring full clinical montages, following the same manual, disagreeing on roughly one epoch in six.
Every consumer staging algorithm is trained to predict those human labels. The label is the target. A device cannot be more correct than the thing it is imitating, and it is imitating a convention with an 83 percent reproducibility rate — using a wrist accelerometer and a green LED, from a limb, through skin, with no EEG at all.

The published validation work says exactly what you would expect. Chinoy and colleagues (2021) tested seven consumer devices against simultaneous polysomnography and found that most performed reasonably at the binary sleep-versus-wake distinction, comparable to research actigraphy, while multi-stage classification was substantially weaker and varied widely by device and by stage. Menghini and colleagues (2021) went further and published a standardized framework for evaluating these devices, precisely because manufacturer accuracy claims were not being computed the same way twice.
Meanwhile clinical sleep medicine has largely moved on. Diagnosis of the major sleep disorders does not hinge on stage percentages. Apnea-hypopnea index, periodic limb movement index, arousal index, oxygen desaturation — the metrics that decide treatment are event counts, not architecture. The stage hypnogram is context. On phones, it became the headline.
The clinical cost of that inversion has a name. Baron and colleagues (2017) described orthosomnia: patients arriving at sleep clinics distressed by tracker data, sometimes with objectively normal sleep, whose pursuit of better numbers was itself degrading their sleep.
The comparison
| Device class | What it actually measures | Median abs. difference vs. the other three on total sleep time | Median nightly "deep sleep" | Where it earns its place |
|---|---|---|---|---|
| Mat (under-mattress) | Movement and cardioballistic force through the mattress | 19 min | 43 min | Zero wear burden; best choice for long-run duration trends and for anyone who cannot tolerate a device on the body |
| Wrist (accel + PPG) | Motion, pulse, HRV | 15 min | 58 min | Best all-round totals and the richest daytime context (resting HR, activity load) |
| Ring (accel + PPG + temp) | Motion, pulse, HRV, skin temperature | 14 min | 71 min | Tightest agreement with the wrist on totals; temperature adds a genuinely independent channel |
| Headband (2-ch frontal EEG) | Frontal cortical activity, plus motion | 21 min | 96 min | The only device measuring the signal the 1968 rules were written for — and the least comfortable to sleep in |
One note on that last row, because it is easy to misread. The headband reported by far the most deep sleep, and it is the only device with an electrical window into the cortex. That does not make it the truth. Two dry frontal channels, no EOG, no chin EMG, on a moving head, is not polysomnography — and frontal placement is exactly where slow waves run largest.
If you want one sentence to screenshot: for total sleep time, the cheap wrist device was as good as the EEG headband, and for deep sleep, none of them were describing the same night.
What we couldn't test
No polysomnography, so no accuracy claim — only concordance. Two sleepers, so no population estimate. Neither sleeper has diagnosed apnea or periodic limb movement, so we cannot say how these devices behave on the fragmented sleep where they would matter most; the published literature suggests staging accuracy degrades further in disordered sleep, and we could not check that. Wearing four devices at once is itself a mild sleep intervention — the headband in particular took the full two acclimation nights to stop registering. And we could not separate within-device consistency from real night-to-night variation: a device that undercounts deep sleep by a fixed amount could still track relative change usefully, and without a reference there is no way to distinguish that from noise.
Who this is for, and who it isn't
Useful if you are: tracking sleep duration and regularity over weeks or months; using bedtime consistency as a behavioral lever; watching resting heart rate or HRV as an illness or training signal; wanting a rough count of nighttime awakenings.
Not useful if you are: trying to improve a deep-sleep percentage; comparing your stage distribution to a friend's or to a population average; using tracker output to decide whether you have a sleep disorder; already anxious about sleep. If checking the app is the first thing you do in the morning and it changes your mood, the device is no longer measuring your sleep — it is participating in it.
See a clinician, not a device, if: you snore and wake unrefreshed, you fall asleep involuntarily during the day, your legs drive you out of bed, or you have been sleeping badly for more than three months. Those are questions for a scored study or a validated home test, and no wrist-worn number substitutes.
Evidence grade
Central claim — consumer sleep-stage estimates are not a reliable night-to-night signal for an individual: Strong. This rests primarily on published polysomnography-referenced validation (Chinoy 2021; the Menghini 2021 evaluation framework) and on inter-scorer reliability data that caps what any device trained on human labels can achieve. Our own 33-night concordance test is convergent supporting evidence at Moderate strength — it demonstrates that the devices contradict each other, which is sufficient to show they cannot all be right, and insufficient to say which is closest.
Secondary claim — total sleep time from consumer devices is usable: Moderate. Four independent sensor technologies agreeing to within about 17 minutes is meaningful, and it matches the published finding that sleep/wake discrimination is the thing these devices genuinely do.
The deep-sleep bar on your screen is an algorithm's guess at a technician's judgment call, made under rules a committee wrote in 1968 with a 75-microvolt line drawn through a continuous signal. It is a filing category, not a substance.
Trust the clock. Doubt the colors.